Notes
|
Topics to be Learn :
|
Introduction :
Analytical chemistry : The branch of chemistry which deals with the study of separation, identification, qualitative and quantitative determination of the compositions of different substances, is called analytical chemistry.
Uses of Analytical chemistry
- Analytical chemistry helps to determine the chemical composition of substances.
- It involves separating, identifying and determining the relative amounts of the components in a sample of matter.
- It uses instruments and methods to separate, identify and quantify the matter under study.
- The analysis thus provides chemical or physical information about a sample.
Applications of analytical chemistry :
- Analytical chemistry has applications in the field of forensic science, engineering and industry such as the pharmaceutical industry and food industry.
- Besides these fields, it is useful in bio-analysis, clinical analysis, environmental analysis and material analysis.
Chemical analysis : Chemical analysis is the study of the chemical composition and structure of substances.
It is of two types : Qualitative and Quantitative.
- Qualitative analysis : Qualitative analysis deals with the detection of the presence or absence of elements in compounds and of chemical compounds in mixtures.
- Quantitative analysis : Quantitative analysis deals with the determination of the relative proportions of elements in compounds and of chemical compounds in mixtures.
Importance of chemical analysis :
- Chemical analysis is one of the most important methods used for determining the composition of raw materials, intermediates and finished products.
- It is also used to determine the composition of air in streets and premises of industrial plants.
- In agriculture, chemical analysis is used to determine the composition of soils and fertilizers.
- In medicine, it is used to determine the composition of medicinal preparations.
Analysis :
Semi-microanalysis :
Analysis is usually carried out on a small sample of the material to be tested. When the amount of a solid or a liquid sample taken for analysis is a few grams, the analysis is called semi-microanalysis.
Semi-microanalysis is of two types : Qualitative and Quantitative.
Apparatus used to carry out semi-micro qualitative analysis.
The semi-micro qualitative analysis is carried out using apparatus such as, test tubes, beakers, evaporating dish, crucible, spot plate, watch glass, wire gauze, water bath, burner, blow pipe, pair of tongs, centrifuge, etc.
Classical methods of analysis :
Classical methods are subdivided into two methods : qualitative and quantitative methods of analysis.
- Classical qualitative methods of analysis include separation methods such as precipitation, extraction and distillation. In these methods identification may be based on differences in colour, odour, melting point, boiling point and reactivity.
- Classical quantitative methods of analysis is achieved by measurement of volume or weight. These methods consist of volumetric analysis, gravimetric analysis, etc. Volumetric analysis is the process which involves measurement of volumes, while gravimetric analysis involves measurement of weight.
Chemical methods of qualitative analysis :
The chemical analysis of a sample is carried out mainly in two stages—by the dry method and the wet method.
- Dry method of chemical analysis : The dry method is usually used as the preliminary tests in the qualitative analysis.
- Wet method of chemical analysis : In this method, the sample under test is first dissolved and then analyzed to determine its composition.
The qualitative analysis of organic and inorganic compounds involves different types of tests.
Tests involved in the qualitative analysis of organic compounds :
- In organic compounds, the elements commonly occurring are carbon, hydrogen, oxygen, nitrogen, sulphur, halogen, phosphorus.
- The detection of the presence of these elements in an organic compound is called the Elementary qualitative analysis. Specific tests are available for each of the individual elements.
- The identification of an organic compound involves tests such as detection of functional group, determination of melting/ boiling point, etc.
Qualitative analysis of inorganic compounds :
The qualitative analysis of simple inorganic compounds seeks to find the elemental composition of inorganic compounds. It mainly involves detection and confirmation of cationic (basic) and anionic (acidic) species in them.
Tests involved in the quantitative analysis of organic compounds :
The quantitative analysis of organic compounds involves methods such as-
- Determination of the percentage of the constituent elements in the organic compound.
- Determination of the concentration of the known compound in the given sample, etc.
Quantitative analytical methods :
Quantitative analytical methods involve measurement of quantities such as mass and volume. Mass can be measured using an apparatus such as weighing balance, while volume can be measured using a burette.
Quantitative analysis of inorganic compounds :
The quantitative analysis of simple inorganic compounds involves methods based on
- Decomposition reactions.
- The progress of the reaction between two solutions till its completion.
Explanation :
The method based on decomposition reactions is Gravimetric analysis. In gravimetric analysis, a measurement of mass or a change in mass provides quantitative information about the substance to be analysed.
The progress of the reaction can be determined using titrimetric or volumetric analysis, etc. Titrimetric or volumetric analysis is a common laboratory method of quantitative chemical analysis where a solution of known concentration is used to determine the concentration of an unknown solution.
Mathematical operation and error analysis :
The accuracy of measurement is of a great concern in analytical chemistry.
Importance of accurate measurements :
- Accurate measurements are important because exact amounts of reagents or chemicals are required for reactions to take place.
- Measurements that are not accurate, provide incorrect data which can lead to wrong or even dangerous conclusions or results.
- For example, if a lab experiment requires a specific amount of a chemical, measuring the wrong amount may result in an unsafe or unexpected outcome.
- Due to all these reasons, accurate measurement is crucial in science.
Accuracy of measurement : Accuracy refers to the nearness of the measured value to the true value or accepted value. It is expressed by the error. Larger the accuracy smaller is the error. Accuracy depends upon the sensitivity or least count i.e the smallest quantity that can be measured on the measuring equipment.
Data report : The numerical data, obtained experimentally, are treated mathematically to reach some quantitative conclusion. Therefore, an analytical chemist has to know how to report the quantitative analytical data,
Care should be taken by an analytical chemist while presenting data :
- The numerical data that is obtained experimentally is first treated mathematically so as to obtain the quantitative conclusion.
- Therefore, an analytical chemist before reporting the quantitative analytical data, should indicate the extent of the accuracy of measurement and then properly express the quantitative error in the result.
Scientific notation (exponential notation) :
A chemist often has to deal with very large numbers or very small numbers.
For example, he may have to use a number as large as 602,200,000,000,000,000,000,000, which is the number of molecules of 2 g of hydrogen gas.
He may also have to use a number as small as 0.00000000000000000000000166 g, which is the mass of a H atom.
To avoid the writing of so many zeros in mathematical operations, scientific notations i.e. exponential notations are used.
Here, any number can be represented into a form N x 10n where 'n' is an exponent having positive or negative values and N can vary 1 ≤ N ≤ 10. Thus, we can write the above values as 6.022 x 10²³ and 1.66 x 10⁻²⁴ g.
The number 123.546 becomes 1.23546 x 10², in scientific notation.
Note that while writing it, we have moved the decimal to the left by two places and same is the exponent (2) of 10 in the scientific notation. Similarly, 0.00015 can be written as 1.5 x 10⁻⁴.
Addition & Subtraction operations performed on numbers expressed in scientific notations :
Addition :
Consider the given problem
Problem : 5.55 x 10⁴ + 6.95 x 10³
Step first : First the exponent is made equal. Thus
5.55 x 10⁴ + 0.695 x 10⁴.
Second Step : Then these numbers can be added as follows :
(5.55 + 0.695) x 104 = 6.245 x 10⁴
Subtraction :
The subtraction of two numbers can be done as shown below:
Problem : 3.5 x 10⁻² - 5.8 x 10⁻³
Step first : First the exponent is made equal. Thus
(3.5 x 10⁻²) - (0.58 x 10⁻²)
Second Step : Then these numbers can be subtracted as follows :
(3.5 - 0.58) x 10-2 = 2.92 x 10⁻²
Multiplication operations performed on numbers expressed in scientific notations :
(i) Multiplication :
Consider the given problem
Problem : ( 5.6 x 105) x (6.9 x 108)
Step first : Multiply the coefficients and add the exponents of the power of 10 separately.
= (5.6 x 6.9) (105+8)
= (5.6 x 6.9) x 1013
= 38.64 x 10¹³
Second Step : Move the decimal place appropriately to get the final answer.
= 3.864 x 10¹⁴
(ii) Multiplication where ‘n’ is an exponent with negative value.
Consider the given problem
Problem : (9.8 x 10-2) x (2.5 x 10-6)
Step first : Multiply the coefficients and add the exponents of the power of 10 separately.
= (9.8 x 2.5) (10-2 + (-6))
= (9.8 x 2.5) x (10-2-6)
= 24.50 x 10⁻⁸
Second Step : Move the decimal place appropriately to get the final answer.
= 2.450 x 10⁻⁷
Precision and accuracy of measurement :
Least count : It is the smallest quantity or value that can be measured on the measuring equipment or instrument.
- A quantity measured with an instrument of smaller least count will have more significant figures and will be more accurate than when measured with an instrument of larger leas count.
Accuracy : Accuracy refers to the nearness of the measured value to the true value or accepted value.
Q. Accuracy depends upon the sensitivity or least count of the measuring equipment.” Explain this statement with a suitable example
Consider, for example, a burette reading of 10.2 mL.
The given figure, shows the three possibilities of a burette reading 10.2 mL. In all the three situations the reading would be noted as 10.2 mL. It means that there is an uncertainty about the digit appearing after the decimal point in the reading 10.2 mL. This is because the least count of the burette is 0.1 mL. Any volume less than 0.1 mL cannot be measured using this burette.
Click here to View Figure-1
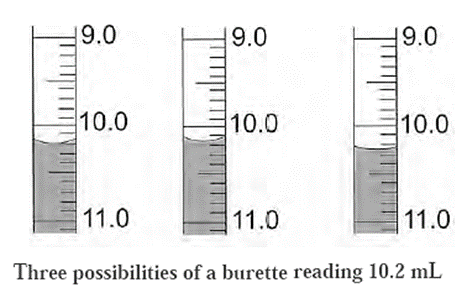
- The meaning of the reading 10.2 mL is that the true value of the reading lies between 10.1 mL and 10.3 mL.
- This is indicated by writing 10.2 ± 0.1 mL.
- Here, the burette reading has an error of ± 0.1 mL. In all the three situations shown in the figure the burette reading can be considered as accurate.
Accuracy of a measurement is expressed in terms of either absolute error or relative error.
Absolute error : Absolute error of a measurement is a measure of how much exactly the observed value or the measured value differs from the true value.
- The absolute error is expressed as the difference between the observed value or measured value and true value.
- Absolute error = Observed value—True value
- It may be noted that the absolute error is reported in the same units as the measurement.
Relative error : Relative error is generally a more useful quantity than absolute error.
- The relative error of a measurement tells us, whether the error of the observed value is big or small compared to the true value.
- Relative error is the ratio of an absolute error to the true value. It is expressed as a percentage.
- Relative error = \(\frac{\text{Absolute error}}{\text{True value}}\) x 100%
Precision : Precision is defined as the closeness between two or more measured values to each other.
Multiple readings of the same quantity are noted to minimize the error. If the readings match closely, they are said to have high precision. Generally, the precision
of a measurement can be readily determined by simply repeating the measurement. High precision is a prerequisite for high accuracy.
- Precision describes the agreement between a result and its true value.
- High precision implies reproducibility of readings.
- Precision is determined by simply replicating a measurement.
- Smaller the difference between the individual values of repeated measurements, greater is the precision.
- Precision is expressed in terms of deviation.
Absolute deviation : An absolute deviation is the modulus of the difference between an observed value and the arithmetic mean for the set of several measurements made in the same way.
Absolute deviation = |Observed value — Mean|
It is a measure of absolute error in the repeated observation.
Mean absolute deviation : The arithmetic mean of all the absolute deviations is called the mean absolute deviation in the measurements.
Relative deviation : It is the ratio of the mean absolute deviation to its arithmetic mean.
- Relative deviation = \(\frac{\text{Mean absolute deviation}}{Mean}\) x 100%
Significant figures : The significant figures in a measurement or result are the number of digits known with certainty plus one uncertain digit.
Rules for deciding significant figures :
- All nonzero digits are significant. For example 127.34 g contains five significant figures which are 1, 2, 7, 3 and 4.
- All zeros become significant, if they are placed between two non zero digits. For example, 120.007 m contains six significant figures which are 1, 2, 0, 0, 0 and 7.
- Zeros on the left of the first non zero digit are not significant. Such a zero indicates the position of the decimal point. For example, 0.025 has two significant figures,
- 2 and 5. 0.005 has only one significant figure, 5.
- All zeros placed at the end of a number are significant if they are on the right side of the decimal point. They represent the accuracy or precision of the measuring scale.
- For example, 243.0 has four significant figures which are 2, 4, 3 and 0.
- Terminal zeros are not significant if there is no decimal point. For example, the measurement 400 g has one significant figure which is 4.
- All digits in numbers written in scientific notation are significant. For example, 2.035 x 10² has four significant figures which are 2, 0, 3 and 5.
- The measurement, 3.25 x 10⁻⁵ has three significant figures viz. 3, 2 and 5.
Q. How can one say that, the number of significant figures indicates the least count of the instrument used for measurement?
Consider the following example.
The measurement 0.400 g has three significant figures 4,0 and 0. The measurement here indicates that the measurements have been made on a weighing balance having least count of 0.001 g.
Q. How are significant figures indicated in scientific notation by means of decimal point?
Consider the following examples.
The measurement 4.0 x 10² g has two significant figures which are 4 and 0, whereas the measurement 4.00 x 10² g has three significant figures which are 4, 0 and 0.
Calculations with significant figures :
When performing calculations with measured quantities the rule is that the accuracy of the final result is limited to the accuracy of the least accurate measurement.
Rounding off : The final result of a calculation often contains figures that are not significant. When this occurs the final result is rounded off.
The following rules are used to round off a number to the required number of significant figures :
- If the digit following the last digit to be kept is less than five, the last digit is left unchanged. For example, 46.32 is rounded off to two significant figures i.e., 46.
- If the digit following the last digit to be kept is five or more, the last digit to be kept is increased by one. For example, 52.87 is rounded off to three significant figures i.e., 52.9.
Determination of molecular formula :
Molecular formula of a compound is the formula which indicates the actual number of atoms of the constituent elements in a molecule.
It can be obtained from the experimentally determined values of percent elemental composition and molar mass of that compound.
Percent composition and empirical formula :
Compounds are formed by the chemical combination of different elements. The per cent elemental composition of a compound is the mass percentage of each element present in the compound.
If the per cent total is not 100, the difference is considered as per cent oxygen.
- Percentage composition : The percentage by mass of each element in a compound is called per cent composition.
- Empirical formula : The simplest ratio of atoms of the constituent elements in a molecule is called the empirical formula of that compound.
- Molecular formula : Molecular formula of a compound is the formula which indicates the actual number of atoms of the constituent elements in a molecule.
Relationship between Empirical formula and Molecular formula :
Molecular formula and empirical formula are related as
Molecular formula=r (empirical formula)
where r is a simple whole number and have values 1, 2, 3.... It is equal to
r = \(\frac{\text{Molecular mass}}{\text{Emperical formula mass}}\)
For example, the molecular mass of benzene = 78
The empirical formula of benzene = CH
The empirical formula mass of benzene = Atomic mass of C + Atomic mass of H
=12+1=13
Molecular mass
Thus r = \(\frac{\text{Molecular mass}}{\text{Emperical formula mass}}=\frac{78}{13}\) = 6
Therefore, the molecular formula of benzene ’
= 6(CH)
= C6H6
Chemical reactions and stoichiometric calculations :
Stoichiometry : The study of quantitative relations between the amount of reactants and products is called stoichiometry.
Stoichiometric calculations : Calculation based on a balanced chemical equations are known as stoichiometric calculations.
Balanced chemical equation:. A symbolic representation of a chemical reaction is a balanced chemical equation.
Information provided by a balanced chemical equation :
A balanced chemical equation is a symbolic representation of a chemical reaction.
It provides the following information :
- It indicates the number of moles of the reactants involved in a chemical reaction and the number of moles of the products formed.
- It indicates the relative masses of the reactants taking part and products formed during the chemical reaction.
- If gases are involved, it indicates the relationship between the volumes of the gaseous reactants and products, at STP.
Stoichiometric problems :
Generally problems based on stoichiometry are of the following types :
- Problems based on mass-mass relationship;
- Problems based on mass-volume relationship and
- Problems based on volume-volume relationship.
Steps involved in problems based on stoichiometric calculations :
- 1 : Write the balanced chemical equation representing the chemical reaction.
- 2 : Write the number of moles and the relative masses or volumes of the reactants and products below the respective formulae.
- 3 : Calculate the relative masses or volumes from the respective formula mass at STP.
- 4. : Apply the unitary method to calculate the unknown factor/s as required by the problem.
Limiting reagent :
Limiting reagent : The reactant in a chemical reaction that limits the amount of product that can be formed is called the limiting agent. The reaction will stop when all of the limiting reactant is consumed.
- A balanced chemical equation gives the ideal stoichiometric relationship among reactants and products. However, when a chemist carries out a reaction, reactants for the experiment are not necessarily present in exact stoichiometric amounts. This is because, the goal of the reaction is to produce the maximum quantity of a useful compound or product from the starting material.
- Many a times, a large excess of one reactant is supplied to ensure that the more expensive reactant is completely converted into the desired product. Thus, the reactant which is present in lesser amounts gets consumed after some time and subsequently, no further reaction takes place.
Excess reagent : The reactant taken in excess which remains unreacted in a chemical reaction is called the excess reagent.
Examples of limiting reagent :
Example : Consider the formation of nitrogen dioxide (NO2) from nitric oxide (NO) and oxygen (O2).
2NO<g> + O2<g> à 2NO2<g>
Suppose initially we have 8 moles of NO and 7 moles of O2. One way to determine which of the two reactants is the limiting reagent is to calculate the number of moles of NO2 obtainable from the given initial quantities of NO and O2.
(a) To find out the number of moles of NO2 produced from 8 moles of NO.
Since 2 mol of NO gives 2 mol of NO2.
8 mol of NO will give = ? mol of NO2.
= 8 mol of NO x\(\frac{\text{2 mole of}NO_2}{\text{2 mol of NO}}\)
= 8 mol NO2
(b) To find out the number of moles of NO2 produced from 7 moles of O2.
Since 1 mol of O2 gives 2 mol of NO2.
7 mol of O2 will give = ? mol of NO2.
= 7 mol of O2 x \(\frac{\text{2 mole of}NO_2}{\text{1 mol of }O_2}\)
= 14 mol of NO2
As per the definition, limiting reagent will yield smaller amount of the product.
Since, 8 moles of NO yields a smaller amount of NO2, NO must be the limiting reagent and O2 is the reagent which is in excess, before the reaction has started.
Concentration of solution :
Concentration of solution : The concentration of a solution or the amount of the substance present in a given volume of a solution can be expressed in different ways as follows :
- Mass per cent or weight per cent (w/w %)
- Mole fraction (x)
- Molarity (M)
- Molality (m).
Mass per cent or weight per cent (w/w %) :
The mass of a solute (in gram or kilogram) present in 100 g (or kg) of a solution is called as mass per cent (or weight per cent). It is denoted by (w/w %).
Mass per cent = \(\frac{\text{Mass of solute}}{\text{Mass of solution}}\) x 100
= \(\frac{\text{Mass of solute}}{\text{Mass of solute + Mass of solvent}}\)x 100
If W2 grams (or Kg) of a solute are present in W grams (or kg) of a solution, then
Mass per cent = \(\frac{W_2}{W}\) x 100 = W/W %
Mole fraction (x) : The mole fraction of any component of a solution is defined as the ratio of number of moles of that component present in the solution to the total number of moles of all the components of the solution.
Mole fraction = \(\frac{\text{Number of moles of component}}{\text{Total no of moles of solute and solvent in solution}}\)
Number of moles of a substance = \(\frac{\text{Mass of substance}}{\text{Molar mass of substance}}=\frac{W}{M}\) mol
If a solution contains n1 moles of solvent and n2 moles of solute, then the total number of moles present in the solution = n1 + n2.
Mole fraction of the solvent x1 = \(\frac{n_1}{n_1+n_2}\)
Mole fraction of the solute x2 = \(\frac{n_2}{n_1+n_2}\)
Mole fraction is independent of temperature and has no units.
Molarity (M) : It is defined as the number of moles of a solute present in 1 litre of a solution.
If n moles of a solute are present in V lit. of a solution then,
Volume of solution in lit.
Molarity(M) = \(\frac{\text{Number of moles of solute}}{\text{Volume of solution in lit}}=\frac{n}{V}\) mol L-1
Molarity = \(\frac{\text{Mass of solute}}{\text{Molar mass of solute × Volume of solution in L.}}\)
= \(\frac{\text{Mass of solute×1000}}{\text{Molar mass of solute × Volume of solution in}cm^3}\)
The unit of molarity is mol litre-1 (mol L-1)
Molarity changes with temperature.
Molality (m) ; It is defined as the number moles of a solute dissolved in 1 kg (or 1000 gram) of a solvent.
Molality (m) = \(\frac{\text{Number of moles of solute}}{\text{Mass of solvent in kg}}\)
= \(\frac{\text{Mass of solute}}{\text{Molar mass of solute × Mass of solvent in kg}}\)
= \(\frac{\text{Mass of solute × 1000}}{\text{Molar mass of solute × Mass of solvent in g}}\)
The unit of molality is mol kg-1 and denoted by m.
Molality is independent of temperature, since it involves mass of solute and mass of solvent which are independent of temperature.
Stock solution : The solution of higher concentration, using which solutions of desired concentration are prepared by dilution is called the stock solution.
Use of graph in analysis :
Graphs are useful tools that can elucidate relationships between two physical parameters. In Analytical chemistry, graphs are plotted when the relation between two properties of matter under study have to be deduced.
- Example: The relation between temperature and volume of a given amount of gas can be studied by plotting a graph of (V) versus (T).
Drawing an average curve through the points on graph :
Consider a set of experimentally measured values of volume (V) and temperature (T) of a definite mass of a gas as plotted on the graph (Fig. (a)).
Click here to View Figure-(a)
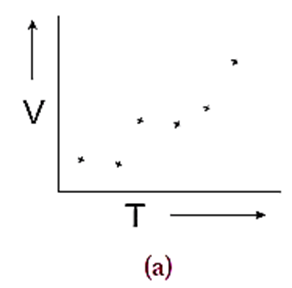
(1) When the points are directly connected, one can see a zig-zag pattern. This pattern results due to many types of errors that have incurred while taking measurements (Fig. (b)). From this pattern no meaningful result can be deduced.
Click here to View Figure-(b)

(2) A straight line can be drawn as shown in Fig. (c). Such a smooth curve is called an average curve. The inference of such a curve is V ∝ T
Click here to View Figure-(c)
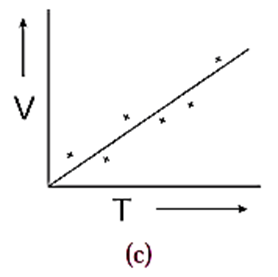
While drawing a smooth curve, care is taken that the plotted points are evenly distributed about it.
Q. Explain mathematically how the straight line drawn on plotted points shows even distribution of the points.
Ans. Consider a set of experimentally measured values of volume (V) and temperature (T) of a definite mass of a gas. While drawing a smooth curve, care is taken that the plotted points are evenly distributed about it. Steps to understand whether the points are evenly distributed : Step 1 : Draw perpendiculars from each point from the curve. The perpendiculars represent the deviation of each point from the curve. The perpendiculars drawn from the points that are above the curve indicate positive deviation. While those below the curve indicate negative deviation (Fig(d)). Step 2 : Take the sum of all the perpendiculars above the curve and the perpendiculars below the curve separately. If the two sums are equal (or nearly equal), the curve drawn is the best possible way of representing the data. Click here to View Figure-(d)

That is good note s