Solutions - Practice Set
Practice Set 6.1
Question 1.1. The following table shows the number of students and the time they utilized daily for their studies. Find the mean time spent by students for their studies by direct method.
| Time (hrs.) | 0−2 | 2−4 | 4−6 | 6−8 | 8−10 |
| No. of students | 7 | 18 | 12 | 10 | 3 |
| Class Time
(hrs) |
Class mark
xi |
Frequency (No. of students)
fi |
Class mark × frequency
xi fi |
| 0−2 | 1 | 7 | 7 |
| 2−4 | 3 | 18 | 54 |
| 4−6 | 5 | 12 | 60 |
| 6−8 | 7 | 10 | 70 |
| 8−10 | 9 | 3 | 27 |
| Total | ∑ fi = 50 | ∑ xi fi = 218 |
The mean is found using the formula
Mean = \(\bar{X} = \frac{∑x_if_i}{∑f_i}=\frac{218}{50}\) = 4.36
∴ The mean time spent by students is = 4.36 hrs
Question 1.2. In the following table, the toll paid by drivers and the number of vehicles is shown. Find the mean of the toll by 'assumed mean' method.
| Toll (Rupees) | 300−400 | 400−500 | 500−600 | 600−700 | 700−800 |
| No. of vehicles | 80 | 110 | 120 | 70 | 40 |
Let us take 550 as the assumed mean.
Then A = 550 and deviation di = Xi − A = Xi − 550
| Class Toll (in ₹.) | Class mark
xi |
di = xi − A
= xi − 550 |
Frequency (No. of vehicles)
fi |
Frequency × Deviation
fi × di |
| 300−400 | 350 | −200 | 80 | –16000 |
| 400−500 | 400 | −100 | 110 | –11000 |
| 500−600 | 550→A | 0 | 120 | 0 |
| 600−700 | 650 | 100 | 70 | 7000 |
| 700−800 | 750 | 200 | 40 | 8000 |
| Total | ∑ fi = 420 | ∑ fi di = –12000 |
Here ∑ fidi = −12000, ∑fi = 420,
\(\bar{d} = \frac{∑f_id_i}{∑f_i}=\frac{−12000}{420}\) = –28.57
Mean, \(\bar{X}\) = A + \(\bar{d}\) = 500 + (–28.57) = 550 – 28.57 = 521.43
∴ The mean of toll is = ₹ 521.43.
Question 1.3. A milk centre sold milk to 50 customers. The table below gives the number of customers and the milk they purchased. Find the mean of the milk sold by direct method.
| Milk Sold (Litre) | 1−2 | 2−3 | 3−4 | 4−5 | 5−6 |
| No. of Customers | 17 | 13 | 10 | 7 | 3 |
| Class Milk sold (Litrs) | Class mark
xi |
Frequency (No. of customers)
fi |
Class marks × frequency
xi fi |
| 1−2 | 1.5 | 17 | 25.5 |
| 2−3 | 2.5 | 13 | 32.5 |
| 3−4 | 3.5 | 10 | 35.0 |
| 4−5 | 4.5 | 7 | 31.5 |
| 5−6 | 5.5 | 3 | 16.5 |
| Total | ∑ fi = 50 | ∑ xi fi = 141 |
Here ∑ xi fi = 141, ∑ fi = 50
Mean = \(\bar{X} = \frac{∑x_if_i}{∑f_i}=\frac{141}{50}\) = 2.82
∴ The mean of milk sold is = 2.82 litres
Question 1.4. A frequency distribution table for the production of oranges of some farm owners is given below. Find the mean production of oranges by 'assumed mean' method.
| Production (Thousand rupees) | 25−30 | 30−35 | 35−40 | 40−45 | 45−50 |
| No. of farm owners | 20 | 25 | 15 | 10 | 10 |
Let us take 37.5 as the assumed mean.
Then A = 37.5 and deviation di = Xi − A =Xi − 37.5
| Class Production (Thousand ₹.) | Class mark
xi |
di = xi − A
= xi – 37.5 |
Frequency
(Farm owners) fi |
Frequency ×
Deviation fi × di |
| 25−30 | 27.5 | −10 | 20 | −200 |
| 30−35 | 32.5 | −5 | 25 | −125 |
| 35−40 | 37.5→A | 0 | 15 | 0 |
| 40−45 | 42.5 | 5 | 10 | 50 |
| 45−50 | 47.5 | 10 | 10 | 100 |
| Total | ∑ fi = 80 | ∑ fi di = –175 |
Here ∑ fidi = −175, ∑fi = 80,
\(\bar{d} = \frac{∑f_id_i}{∑f_i}=\frac{−175}{80}\) = –2.1875 ≈ −2.19
Mean, \(\bar{X}\) = A + \(\bar{d}\) = 37.5 + (–2.19) = 35.31 Thousands = 35310
∴ The mean of production of oranges is = ₹ 35310.
Question 1.5. A frequency distribution of funds collected by 120 workers in a company for the drought affected people are given in the following table. Find the mean of the funds by 'step deviation' method.
| Fund (Rupees) | 0−500 | 500−1000 | 1000−1500 | 1500−2000 | 2000−2500 |
| No. of workers | 35 | 28 | 32 | 15 | 10 |
Let us take A = 1250, and g = 500
| Class Fund (₹.) | Class mark
xi |
di = xi − A
= xi – 1250 |
ui = di/g
= di/500 |
Frequency (No. of workers)
fi |
fi ui |
| 0−500 | 250 | −1000 | −2 | 35 | −70 |
| 500−1000 | 750 | −500 | −1 | 28 | −28 |
| 1000−1500 | 1250→A | 0 | 0 | 32 | 0 |
| 1500−2000 | 1750 | 500 | 1 | 15 | 15 |
| 2000−2500 | 2250 | 1000 | 2 | 10 | 20 |
| Total | ∑ fi = 120 | ∑ fi ui = –63 |
Here ∑ fidi = −63, ∑fi = 120, g = 500
\(\bar{u} = \frac{∑f_iu_i}{∑f_i}=\frac{−63}{120}\) = –0.525
Mean, \(\bar{X}\) = A + \(\bar{u}\)g = 1250 + (–0.525) x 500 = 1250 – 262.5 = 987.50
∴ The mean of the funds is = ₹ 987.50
Question 1.6. The following table gives the information of frequency distribution of weekly wages of 150 workers of a company. Find the mean of the weekly wages by 'step deviation' method.
| Weekly wages (Rupees) | 1000−2000 | 2000−3000 | 3000−4000 | 4000−5000 |
| No. of workers. | 25 | 45 | 50 | 30 |
Let us take A = 2500, and g = 1000
| Class Weekly wages (₹.) | Class mark
xi |
di = xi − A
= xi – 2500 |
ui = \(\frac{d_i}{g}\)
= \(\frac{d_i}{500}\) |
Frequency (No. of workers)
fi |
fi ui |
| 1000−2000 | 1500 | −1000 | 1 | 25 | −25 |
| 2000−3000 | 2500→A | 0 | 0 | 45 | 0 |
| 3000−4000 | 3500 | 1000 | 1 | 50 | 50 |
| 4000−5000 | 4500 | 2000 | 2 | 30 | 60 |
| Total | ∑ fi = 150 | ∑ fi ui = 85 |
Here ∑ fidi = 85, ∑fi = 150, g = 1000
\(\bar{u} = \frac{∑f_iu_i}{∑f_i}=\frac{85}{150}\) = 0.57
Mean, \(\bar{X}\) = A + \(\bar{u}\)g = 2500 + 0.57 x 1000 = 2500 + 570 = 3070
∴ The mean of weekly wages is = ₹ 3070
Practice Set 6.2
Question 2.1. The following table shows classification of number of workers and the number of hours they work in a software company. Find the median of the number of hours they work.
| Daily No. of hours | 8−10 | 10−12 | 12−14 | 14−16 |
| Number of workers | 150 | 500 | 300 | 50 |
| Class (Daily no. of hrs.) | Frequency (No. of workers)
fi |
Cumulative frequency (less than type)
cf |
| 8−10 | 150 | 150 −> cf |
| 10−12 (median class) | 500 −> f | 650 |
| 12−14 | 300 | 950 |
| 14−16 | 50 | 1000 |
| N = ∑fi = 1000 |
Here, total of frequencies N = ∑fi = 1000
\(\frac{N}{2}=\frac{1000}{2}\) = 500. Cumulative frequency which is just greater than 500 is 650.
∴ the corresponding class 10−12 is the median class.
L = 10, f = 500 (Frequency of the median class), cf = 150, h = 2
Median = L + \([\frac{\frac{N}{2}−cf}{f}]\) × h
= 10 + \(\frac{500−150}{500}\) × 2 = 10 + × 2
= 10 + \(\frac{350}{500}\) × 2 = 10 + 1.4 = 11.4
∴ The median of the number of hours they work = 11.4
Question 2.2. The frequency distribution table shows the number of mango trees in a grove and their yield of mangoes. Find the median of data.
| No. of Mangoes | 50−100 | 100−150 | 150−200 | 200−250 | 250−300 |
| No. of trees | 33 | 30 | 90 | 80 | 17 |
| Class (No. of mangoes) | Frequency (No. of trees)
fi |
Cumulative frequency (less than type)
cf |
| 50−100 | 33 | 33 |
| 100−150 | 30 | 63 −> f |
| 150−200 (median class) | 90 −> f | 153 |
| 200−250 | 80 | 233 |
| 250−300 | 17 | 250 |
| N = ∑fi = 250 |
Here, total of frequencies N = ∑fi = 250
\(\frac{N}{2}=\frac{250}{2}\) = 125. Cumulative frequency which is just greater than 125 is 153.
∴ the corresponding class 150−200 is the median class.
L = 150, f = 90, cf = 63, h = 50
Median = L + \([\frac{\frac{N}{2}−cf}{f}]\) × h
= 150 + \(\frac{125−63}{90}\) × 50
= 150 + \(\frac{62}{90}\) × 50 = 150 + 34.4 = 184.4
∴ The median of the data = 184.4 mangoes i.e. 184 mangoes approx
Question 2.3. The following table shows the classification of number of vehicles and their speeds on Mumbai−Pune express way. Find the median of the data.
| Average Speed of
Vehicles(Km / hr) |
60−64 | 64−69 | 70−74 | 75−79 | 79−84 | 84−89 |
| No. of vehicles | 10 | 34 | 55 | 85 | 10 | 6 |
The classes (Average speed of vehicles) in the table are not continuous.
To find the median, the classes must be continuous.
The difference between the upper class limit of a class and the lower class limit of it succeeding class is 1.
Therefore, subtract = 0.5 from the lower class limit of each class and add 0.5 to the upper class limit of each class.
Make a column of cf (less than type) in the new table showing the continuous classes.
| Class (Average speed of vehicles) | Continuous classes | Frequency (No. of vehicles)
fi |
Cumulative frequency (less than type)
cf |
| 60−64 | 59.5−64.5 | 10 | 10 |
| 65−69 | 64.5−69.5 | 34 | 44 |
| 70−74 | 69.5−74.5 | 55 | 99 −> f |
| 75−79 (median class) | 74.5−79.5 | 85 −> f | 184 |
| 80−84 | 79.5−84.5 | 10 | 194 |
| 85−89 | 84.5−89.5 | 6 | 200 |
| N = ∑fi = 200 |
Here, total of frequencies N = ∑fi = 200
\(\frac{N}{2}=\frac{200}{2}\) = 100. Cumulative frequency which is just greater than 100 is 184.
∴ the corresponding class 74.5−79.5 is the median class.
L = 74.5, f = 85, cf = 99, h = 5
Median = L + \([\frac{\frac{N}{2}−cf}{f}]\) × h
= 74.5 + \(\frac{100−99}{85}\) × 5
= 74.5 + \(\frac{1}{17}\) = 74.5 + 0.06 = 74.56 ≈ 75
∴ The median of the data = 75 vehicles.
Question 2.4. The production of electric bulbs in different factories is shown in the following table. Find the median of the productions.
| No. of bulbs
produced (Thousands) |
30−40 | 40−50 | 50−60 | 60−70 | 70−80 | 80−90 | 90−100 |
| No. of factories | 12 | 35 | 20 | 15 | 8 | 7 | 8 |
| Class (No. of mangoes) | Frequency (No. of trees)
fi |
Cumulative frequency (less than type)
cf |
| 30−40 | 12 | 12 |
| 40−50 | 35 | 47 −> f |
| 50−60 (median class) | 20 −> f | 67 |
| 60−70 | 15 | 82 |
| 70−80 | 8 | 90 |
| 80−90 | 7 | 97 |
| 90−100 | 8 | 105 |
| N = ∑fi = 105 |
Here, total of frequencies N = ∑fi = 105
\(\frac{N}{2}=\frac{105}{2}\) = 52.5. Cumulative frequency which is just greater than 52.5 is 67.
∴ the corresponding class 150−200 is the median class.
L = 50, f = 20, cf = 47, h = 10
Median = L + \([\frac{\frac{N}{2}−cf}{f}]\) × h
= 50 + \(\frac{52.5−47}{20}\) × 10
= 50 + \(\frac{5.5}{2}\) = 50 + 2.75 = 52.75 thousand = 52750.
∴ The median of the production is = 52750.
Practice Set 6.3
Question 3.1. The following table shows the information regarding the milk collected from farmers on a milk collection centre and the content of fat in the milk, measured by a lactometer. Find the mode of fat content.
| Content of fat (%) | 2−3 | 3−4 | 4−5 | 5−6 | 6−7 |
| Milk collected (Litre) | 30 | 70 | 80 | 60 | 20 |
| Content of fat (%) | 2−3 | 3−4 | 4−5 | 5−6 | 6−7 |
| Milk collected (Litre) | 30 | 70 → f0 | 80 → f1 | 60→ f2 | 20 |
Here the maximum frequency (80) is in the class 4−5.
∴ the model class is 4−5,
L = Lower class limit of the modal class = 4
h = Class interval of the modal class = 1
f1 = Frequency of the modal class = 80
f0 = Frequency of the class preceding the modal class = 70
f2 = Frequency of the class succeeding the modal class = 60
Mode = L + \([\frac{f_1−f_0}{2f_1−f_0−f_2}]\) × h
= 4 + \([\frac{80−70}{2(80)−70−60}]\) × 1
= 4 + \([\frac{10}{30}]\)
= 4 + 0.33
= 4.33
∴ the mode of fat content is 4.33%.
Question 3.2. Electricity used by some families is shown in the following table. Find the mode for use of electricity.
| Use of electricity (Unit) | 0−20 | 20−40 | 40−60 | 60−80 | 80−100 | 100−120 |
| No. of families | 13 | 50 | 70 | 100 | 80 | 17 |
| Use of electricity (Unit) | 0−20 | 20−40 | 40−60 | 60−80 | 80−100 | 100−120 |
| No. of families | 13 | 50 | 70 → f0 | 100 → f1 | 80 → f2 | 17 |
Here the maximum frequency (100) is in the class 60−80.
∴ the model class is 60−80,
L = Lower class limit of the modal class = 60
h = Class interval of the modal class = 20
f1 = Frequency of the modal class = 100
f0 = Frequency of the class preceding the modal class = 70
f2 = Frequency of the class succeeding the modal class = 80
Mode = L + \([\frac{f_1−f_0}{2f_1−f_0−f_2}]\) × h
= 60 + \([\frac{100−70}{2(100)−70−80}]\) × 20
= 60 + \([\frac{300}{200−150}]\) × 20
= 60 + \([\frac{30}{50}]\) × 20
= 60 + 12
= 72
∴ the mode for the use of electricity is 72 units
Question 3.3. Grouped frequency distribution of supply of milk to hotels and the number of hotels is given in the following table. Find the mode of the supply of milk.
| Milk (Litre) | 1−3 | 3−5 | 5−7 | 7−9 | 9−11 | 11−13 |
| No. of hotels | 7 | 5 | 15 | 20 | 35 | 18 |
| Milk (Litre) | 1−3 | 3−5 | 5−7 | 7−9 | 9−11 | 11−13 |
| No. of hotels | 7 | 5 | 15 | 20 → f0 | 35 → f1 | 18 → f2 |
Here the maximum frequency (35) is in the class 9−11.
∴ the model class is 9−11,
L = Lower class limit of the modal class = 9
h = Class interval of the modal class = 2
f1 = Frequency of the modal class = 35
f0 = Frequency of the class preceding the modal class = 20
f2 = Frequency of the class succeeding the modal class = 18
Mode = L + \([\frac{f_1−f_0}{2f_1−f_0−f_2}]\) × h
= 9 + \([\frac{35−20}{2(35)−20−18}]\) × 2
= 9 + \([\frac{15}{70−38}]\) × 2
= 9 + \([\frac{15}{32}]\) × 2
= 9 + \([\frac{15}{16}]\)
= 9 + 0.9375 ≈ 9.94
∴ the mode of the supply of milk is 9.94 litres
Question 3.4. The following frequency distribution table gives the ages of 200 patients treated in a hospital in a week. Find the mode of ages of the patients.
| Age (years) | Less than 5 | 5−9 | 10−14 | 15−19 | 20−24 | 25−29 |
| No. of patients | 38 | 32 | 50 | 36 | 24 | 20 |
Less than 5 means 0 to 4. The age cannot be negative.
In the table, the classes are not continuous.
We get the following frequency distribution table after making the classes continuous.
| Class Age (Years) | Class | Continuous classes | Frequency (No. of patients) |
| Less than 5 | 0−4 | 0−4.5 | 38 |
| 5−9 | 5−9 | 4.5−9.5 | 32 → f0 |
| 10−14 | 10−14 | 9.5−14.5 | 50 → f1 |
| 15−19 | 15−19 | 14.5−19.5 | 36 → f2 |
| 20−24 | 20−24 | 19.5−24.5 | 24 |
| 25−29 | 25−29 | 24.5−29.5 | 20 |
From the table model class is 9.5−14.5,
L = Lower class limit of the modal class = 9.5
h = Class interval of the modal class = 5
f1 = Frequency of the modal class = 50
f0 = Frequency of the class preceding the modal class = 32
f2 = Frequency of the class succeeding the modal class = 36
Mode = L + \([\frac{f_1−f_0}{2f_1−f_0−f_2}]\) × h
= 9.5 + \([\frac{50−32}{2(50)−32−36}]\) × 5
= 9.5 + \([\frac{18}{100−68}]\) × 5
= 9.5 + \([\frac{18}{32}]\) × 5
= 9.5 + 2.815 ≈ 12.31
∴ The mode of the ages of the patients is 12.31 years
Practice Set 6.4
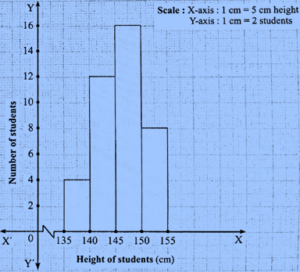
Question 4.1. Draw a histogram of the following data.
| Height of student (cm) | 135−140 | 140−145 | 145−150 | 150−155 |
| No. of students | 4 | 12 | 16 | 8 |
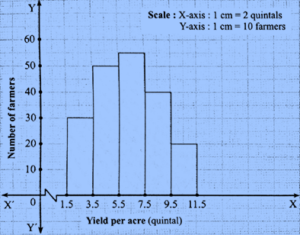
Question 4.2. The table below shows the yield of jowar per acre. Show the data by histogram.
| Yield per acre (quintal) | 2−3 | 4−5 | 6−7 | 8−9 | 10−11 |
| No. of farmers | 30 | 50 | 55 | 40 | 20 |
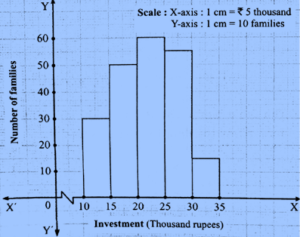
Question 4.3. In the following table, the investment made by 210 families is shown. Present it in the form of a histogram.
| Investment (Thousand Rupees) | 10−15 | 15−20 | 20−25 | 25−30 | 30−35 |
| No. of families | 30 | 50 | 60 | 55 | 15 |
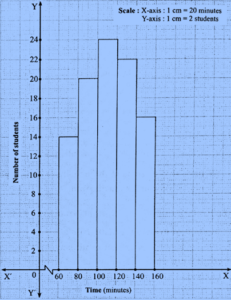
Question 4.4. Time alloted for the preparation of an examination by some students is shown in the table. Draw a histogram to show the information.
| Time (minutes) | 60−80 | 80−100 | 100−120 | 120−140 | 140−160 |
| No. of students | 14 | 20 | 24 | 22 | 16 |
Practice Set 6.5
Question 5.1. Observe the following frequency polygon and write the answers of the questions below it.
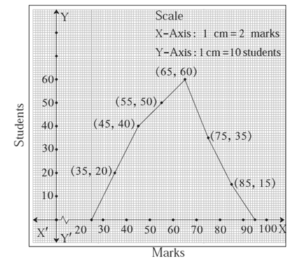
(1) Which class has the maximum number of students?
(2) Write the classes having zero frequency.
(3) What is the class−mark of the class, having frequency of 50 students?
(4) Write the lower and upper class limits of the class whose class mark is 85.
(5) How many students are in the class 80−90?
(1) The class 60 − 70 has the maximum number of students, i.e., 60.
(2) The classes 20 − 30 and 90 − 100 have zero frequency.
(3) The class−mark of the class having frequency of 50 students is 55.
(4) The lower and upper class limits of the class having class marks of 85 are 80 and 90.
(5) Number of students in the class 80−90 are 15.
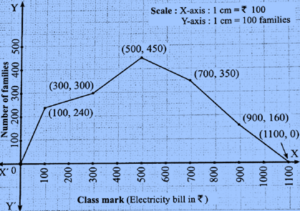
Question 5.2. Show the following data by a frequency polygon.
| Electricity bill (₹) | 0−200 | 200−400 | 400−600 | 600−800 | 800−1000 |
| Families | 240 | 300 | 450 | 350 | 160 |
| Class Electricity Bill (Rs.) | Class Mark | Frequency (Families) | Coordinates of points |
| 0−200 | 100 | 240 | (100,240) |
| 200−400 | 300 | 300 | (300,300) |
| 400−600 | 500 | 450 | (500,450) |
| 600−800 | 700 | 350 | (700,350) |
| 800−1000 | 900 | 160 | (900,160) |
| 1000−1200 | 1100 | 0 | (1100,0) |
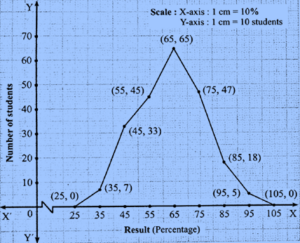
Question 5.3. The following table shows the classification of percentages of marks of students and the number of students. Draw a frequency polygon from the table.
| Result
(Percentage) |
30−40 | 40−50 | 50−60 | 60−70 | 70−80 | 80−90 | 90−100 |
| No. of students | 7 | 33 | 45 | 65 | 47 | 18 | 5 |
| Class Results (%) | Class Mark | Frequency (No. of students) | Coordinates of points |
| 20−30 | 25 | 0 | (25, 0) |
| 30−40 | 35 | 7 | (35, 7) |
| 40−50 | 45 | 33 | (45, 33) |
| 50−60 | 55 | 45 | (55, 45) |
| 60−70 | 65 | 65 | (65, 65) |
| 70−80 | 75 | 47 | (75, 47) |
| 80−90 | 85 | 18 | (85, 18) |
| 90−100 | 95 | 5 | (95, 5) |
| 100−110 | 105 | 0 | (105,0) |
Practice Set 6.6
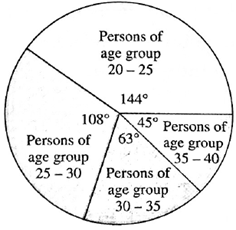
Question 6.1. The age group and number of persons, who donated blood in a blood donation camp is given below. Draw a pie diagram from it.
| Age group (Yrs) | 20−25 | 25−30 | 30−35 | 35−40 |
| No. of persons | 80 | 60 | 35 | 25 |
The number of persons are converted into component parts of 360° in the following table :
| Age group (Years) | No. of persons | Measure of the central angle. |
| 20−25 | 80 | \(\frac{80}{200}\) x 3600 = 1440 |
| 25−30 | 60 | \(\frac{60}{200}\) x 3600 = 1080 |
| 30−35 | 35 | \(\frac{35}{200}\) x 3600 = 630 |
| 35−40 | 25 | \(\frac{25}{200}\) x 3600 = 450 |
| Total | 200 | 3600 |
On the basis of the table, the pie diagram is drawn :
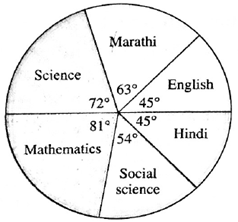
Question 6.2. The marks obtained by a student in different subjects are shown. Draw a pie diagram showing the information.
| Subject | English | Marathi | Science | Mathematics | Social science | Hindi |
| Marks | 50 | 70 | 80 | 90 | 60 | 50 |
The marks obtained are converted into component parts of 360° in the following table :
| Subjects | Marks | Measure of the central angle. |
| English | 50 | \(\frac{50}{400}\) x 3600 = 450 |
| Marathi | 70 | \(\frac{70}{400}\) x 3600 = 630 |
| Science | 80 | \(\frac{80}{400}\) x 3600 = 720 |
| Mathematics | 90 | \(\frac{90}{400}\) x 3600 = 810 |
| Social Science | 60 | \(\frac{60}{400}\) x 3600 = 540 |
| Hindi | 50 | \(\frac{50}{400}\) x 3600 = 450 |
| Total | 400 | 3600 |
On the basis of the table, the pie diagram is drawn :
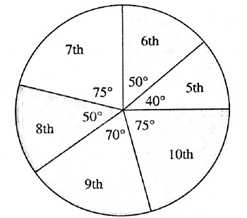
Question 6.3. In a tree plantation programme, the number of trees planted by students of different classes is given in the following table. Draw a pie diagram showing the information.
| Standard | 5 th | 6 th | 7 th | 8 th | 9 th | 10 th |
| No. of trees | 40 | 50 | 75 | 50 | 70 | 75 |
The number of trees are converted into component parts of 360° as shown in the following table :
| Standard | Number of trees | Measure of the central angle. |
| 5th | 40 | \(\frac{40}{360}\) x 3600 = 400 |
| 6th | 50 | \(\frac{50}{360}\) x 3600 = 500 |
| 7th | 75 | \(\frac{75}{360}\) x 3600 = 750 |
| 8th | 50 | \(\frac{50}{360}\) x 3600 = 500 |
| 9th | 70 | \(\frac{70}{360}\) x 3600 = 700 |
| 10th | 75 | \(\frac{75}{360}\) x 3600 = 750 |
| Total | 360 | 3600 |
Pie diagram :
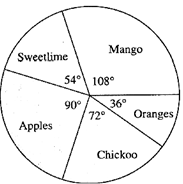
Question 6.4. The following table shows the percentages of demands for different fruits registered with a fruit vendor. Show the information by a pie diagram.
| Fruits | Mango | Sweet lime | Apples | Cheeku | Oranges |
| Percentages of demand | 30 | 15 | 25 | 20 | 10 |
The Percentages of demand are converted into component parts of 360° as shown in the following table :
| Fruits | Percentage of demand | Measure of the central angle. |
| Mango | 30 | \(\frac{30}{100}\) x 3600 = 1080 |
| Sweet lime | 15 | \(\frac{15}{100}\) x 3600 = 540 |
| Apples | 25 | \(\frac{25}{100}\) x 3600 = 900 |
| Cheeku | 20 | \(\frac{20}{100}\) x 3600 = 720 |
| Oranges | 10 | \(\frac{10}{100}\) x 3600 = 360 |
| Total | 100 | 3600 |
Pie diagram :
Question 6.5. The pie diagram in figure 6.13 shows the proportions of different workers in a town. Answer the following questions with its help.
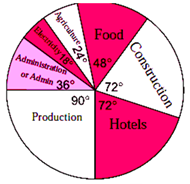
(1) If the total workers is 10,000; how many of them are in the field of construction?
(2) How many workers are working in the administration?
(3) What is the percentage of workers in production?
(1) Let number of workers in the field of construction = x.
The total number of workers is 10,000.
The central angle for construction = \(\frac{\text{workers in the field of construction}}{\text{The total number of workers}}\) x 3600
∴ 720 = \(\frac{x}{10000}\) x 3600
∴ x = \(\frac{72×10000}{360}\) = 2000
(2) Let number of workers working in the administration = y.
The total number of workers is 10,000.
The central angle for construction = \(\frac{\text{the workers in the administration}}{\text{The total number of workers}}\) x 3600
∴ 360 = \(\frac{y}{10000}\) x 3600
∴ y = \(\frac{36×10000}{360}\) = 1000
(3) The central angle for the workers in production is given to be 90°.
The percentage of workers in production = \(\frac{90^0}{360^0}\) x 100 = \(\frac{1}{4}\) x 100 = 25%
Answer is, (1) Number of workers in the field of construction = 2000, (2) Number of workers working in the administration = 1000, (3) Percentage of workers in production = 25%
Question 6.6. The annual investments of a family are shown in the adjacent pie diagram. Answer the following questions based on it.
(1) If the investment in shares is ₹ 2000/, find the total investment.
(2) How much amount is deposited in bank?
(3) How much more money is invested in immovable property than in mutual fund?
(4) How much amount is invested in post?
(1) Let the total investment be ₹ x.
The central angle for the investment in shares is given to be 60°.
The central angle for the investment in shares = \(\frac{\text{the investment in shares}}{\text{total investment}}\) x 360°
∴ 600 = \(\frac{2000}{x}\) x 3600
∴ x = \(\frac{2000}{60^0}\) x 3600 = 12000
∴ total investment = ₹ 12000.
(2) Let the amount deposited in the bank be ₹ y.
The central angle for the amount deposited in the bank = \(\frac{\text{the amount deposited in the bank}}{\text{total investment}}\) x 3600 ... (The central angle for the amount deposited in bank is given to be 90°)
∴ 900 = \(\frac{y}{12000}\) x 3600
∴ y = \(\frac{90×12000}{360}\) = 3000
(3) Let the amount invested in the mutual fund be ₹ z.
The central angle for the amount invested in the mutual fund is 60°.
The central angle for mutual fund = \(\frac{\text{the amount invested in the mutual fund}}{\text{total investment}}\) x 3600
∴ 600 = \(\frac{z}{12000}\) x 3600
∴ z = \(\frac{60×12000}{360}\) = 2000 ….(i)
Now, we find the money invested in the immovable property. Let it be ₹ p.
The central angle for the immovable property = \(\frac{\text{he money invested in the immovable property}}{\text{total investment}}\) x 3600
∴ 1200 = \(\frac{p}{12000}\) x 3600
∴ p = \(\frac{120×12000}{360}\) = 4000 ….(ii)
More money invested in the immovable property
= ₹ (4000 — 2000) ….[From (i) and (ii)]
= ₹ 2000
(4) The amount invested in the post = Total investment — (Investments in MF + immovable property + bank + shares)
= ₹ [12000 — (2000 + 4000 + 3000 + 2000)]
= ₹ (12000 — 11000) = ₹ 1000
Answer is, Investments are as follows :
(1) Total investment : ₹ 12,000 (2) Deposited in Bank : ₹ 3000 (3) More immovable property than MF : ₹ 2000 (4) Investment in Post : ₹ 1000.
We reply to valid query.